13. Quiz: Box Plots

Box Plots
QUIZ QUESTION::
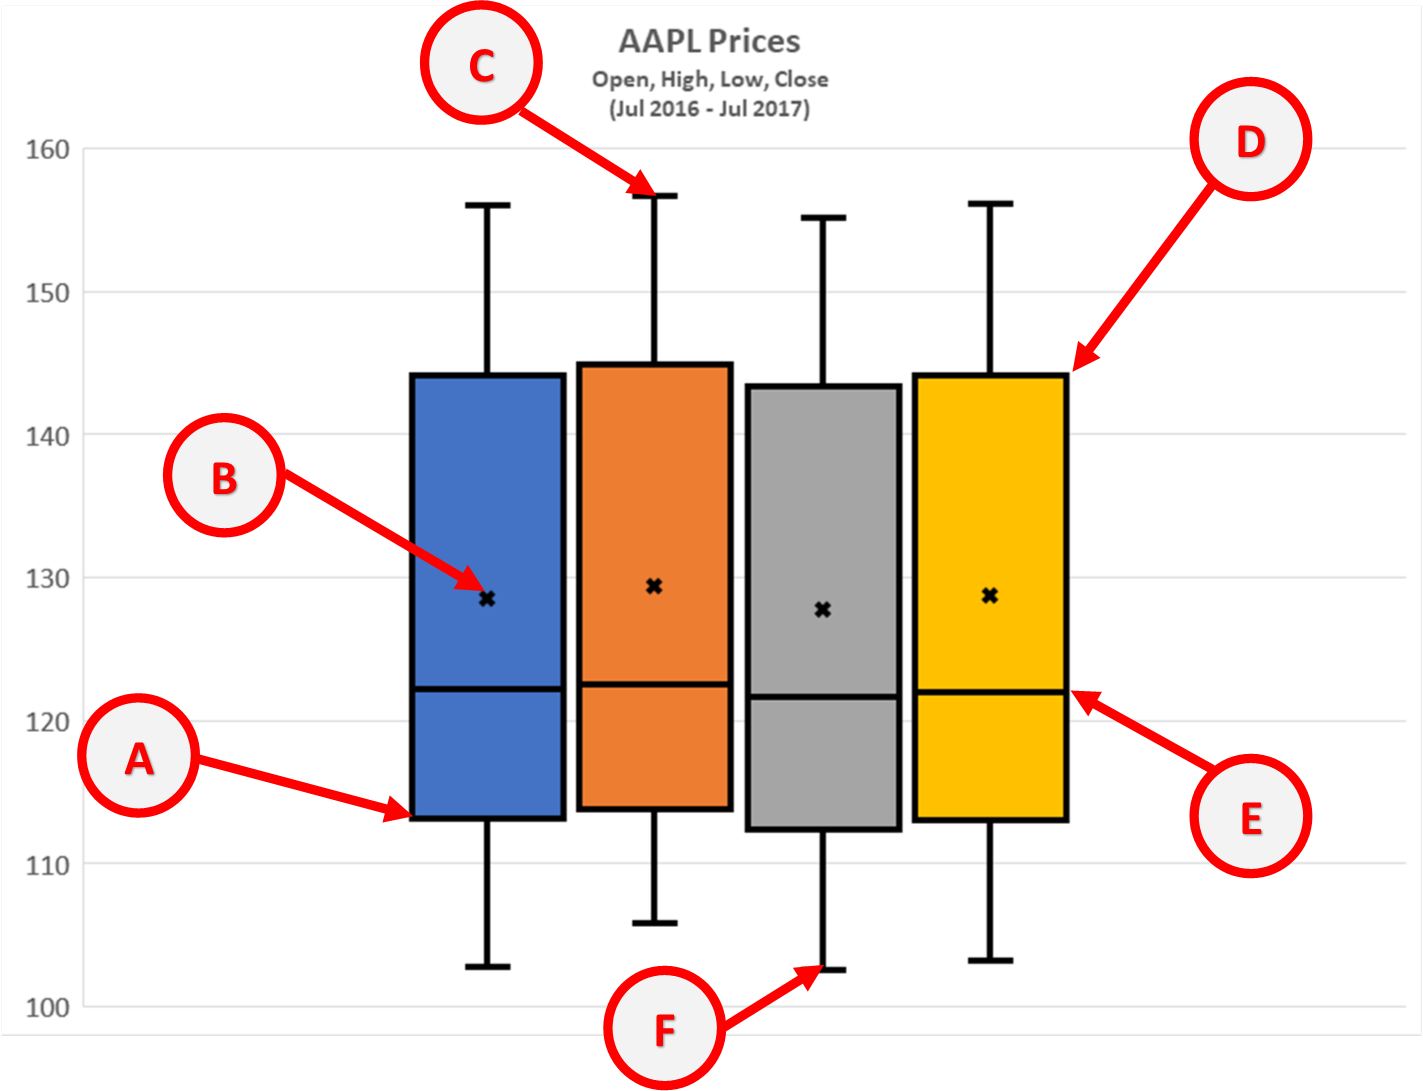
Box and Whisker Plots give us a visualization of statistical spread using the "5 Number Summary". Excel even provides a 6th number visualization as a bonus. Match the following parts of the box plot above to the these statistical values.
ANSWER CHOICES:
|
Statistic |
Location on Diagram |
|---|---|
A |
|
E |
|
D |
|
F |
|
C |
|
B |
|
E |
SOLUTION:
|
Statistic |
Location on Diagram |
|---|---|
|
A |
|
|
E |
|
|
E |
|
|
D |
|
|
F |
|
|
C |
|
|
B |
|
|
E |
|
|
E |